It is very important to have consistent memory model for your project from the start, because it is almost impossible to change it later. In this post I will talk about Emergence memory management library and its design decisions.
Motivation
Having the right approach to managing memory is crucial for performance: it impacts both allocation cost and cache coherency. Of course, you can just allocate all the memory on heap by using new, but it will lead to slow allocation, cache misses and memory fragmentation. In my opinion, game engine without consistent memory management model is like giant with legs made of straw. Therefore, I decided that Emergence must be built on top of consistent memory library from the very beginning. Furthermore, I’ve decided to write my own memory management library to have full control on how memory allocation works.
Writing your own memory management library is not a walk in the park and it’s quite easy to get lost in details. For example, if you’re committed enough, you can try to ignore the existence of C standard library allocation functions and write your own platform-specific versions. But it is a tedious and troublesome task. I’ve decided to be less thorough about that and primarily focus on the API instead of implementation details: once API is done right and whole project uses it, it shouldn’t be difficult to change implementation details under the hood.
One important part about memory management model is that it should not only be consistent and easy to use, but also provide tools for memory usage analysis, for example custom profiler. Having such tools is important because they allow us to visualize how we’re using memory and provide us with insight on what can be improved. When I was searching for such tool to integrate into my memory management library, I’ve mostly encountered tools that track memory allocations by file name or by one of the static predefined tags. It looked like it is not good enough for Emergence: I wanted to be able to build dynamic memory usage flame graph and none of the tools I found was fully capable of doing so. Therefore I’ve decided that I need to write my own tool.
To summarize, I’ve decided to follow these principles:
- The most important part is consistent and easy-to-use API.
- C standard library functions is a good enough backend for the beginning.
- Library must provide API and a tool for memory usage profiling and analysis.
Features
It is important to have a rich enough feature set. It should be neither too small nor too big: it should provide enough control on how memory is allocated, but user must not sink in the sea of details. I’ve decided to go with this feature set for Emergence memory management library:
- Unordered pool allocator for lighting-fast allocation and deallocation of objects of the same type.
- Ordered pool allocator, that has slow deallocation operation, but is more cache coherent and provides iteration over allocated chunks.
- Stack allocator for lighting-fast cache-coherent allocation of temporary trivial objects.
- Heap allocator for general purpose allocation.
- String interning implementation for ASCII strings.
It’s better to provide memory usage profiler features as separate list to avoid blending with memory management features:
- Memory usage is tracked for logical groups that can be created at any moment during runtime.
- Memory usage snapshot for all logical groups can be taken at any moment of time. It makes sampling-based profiling possible.
- Profiler should be able to represent all memory operations as continuous set of events. It makes instrumentation-based profiling possible.
- There should be an API for serializing and deserializing memory usage tracks: initial memory snapshot and continuous set of events that happened after this snapshot.
- There should be a tool for viewing memory tracks.
Initially I also wanted to implement client-server profiler like Tracy, but I’ve decided to postpone it. It is not so difficult, but it requires time and I’ve decided that it is better to spend this time on other Emergence libraries.
Allocators
Pool
Pool allocators manage memory in terms of chunks and pages. Chunk is a memory block of predefined size which is usually selected during allocator construction. Page is a large continuous block of chunks. Pages are organized into linked list: each page contains pointer to the next one. Chunks can either be used or unused: used chunks contain user-defined data and free chunks are organized into free-chunk linked list – every free chunk contains pointer to the next one. To sum up, referencing looks like this:
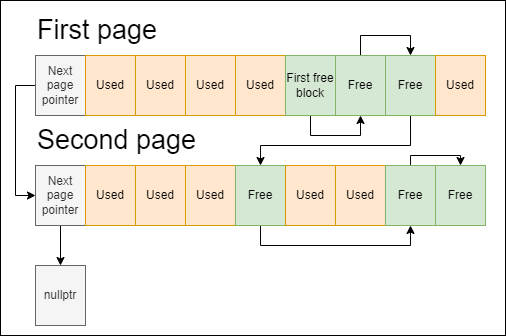
When user requests new chunk from the allocator, we start by checking whether free chunk list is empty. If it’s not empty, we can just pop the first chunk out of this list and return it to user. If there is no free chunks left, we need to allocate new page and put all the chunks from this page into free chunk list.
When user reports that he no longer uses given chunk, we can just put this chunk back into free chunks list and that’s all! But there is one important question: are we putting this chunk into the beginning of free chunk list or into other place? This question defines main algorithmic difference between ordered and unordered pools. Basically, ordered pool guarantees that page list and free chunk list are sorted by addresses in ascending order. You can see that image above illustrates ordered pool. This ordering provides several benefits:
- Memory allocation is more cache coherent as free chunk list ordering minimizes amount of holes between used chunks.
- Pool shrinking (deallocation of fully unused pages) can be implemented effectively: it can be done in O(pageCount + freeChunkCount) instead of O(pageCount * pageCapacity * freeChunkCount), because we do not need to iterate over all free chunk list to determinate whether chunk is free.
- Iteration over used chunks can be implemented effectively for the same reason.
However, ordering is not a silver bullet, because it has one important flaw: it makes release operation (when user informs that chunk is no longer used) O(freeChunksCount) – we need to find suitable place for new chunk in the list. This can introduce significant performance drops if we’re releasing lots of chunks in a random order. Therefore, usage of ordered or unordered pool is always a trade-off and memory usage strategy should be considered thoroughly before selecting one pool type over another.
Emergence::Memory service provides both type of pools as separate classes: OrderedPool and UnorderedPool. This allows user to select pool algorithm with zero runtime overhead. They both provide this set of operations:
Acquirerequests new chunk from the pool.Releasereturns chunk that is no longer used to the pool.IsEmptychecks whether pool has any used chunk.Cleardeallocates all pages altogether.
In addition, OrderedPool supports these operations:
- Iteration over acquired (used) chunks through
BeginAcquired/EndAcquired. Shrinkdeallocates all pages that have no used chunks.
It is worth mentioning that both pools support custom chunk alignment that can be specified during allocator creation.
In the end, let’s go over the pros and cons of pool allocator usage.
Pros:
- Generally faster allocation and deallocation: operations on free chunk list are much more lightweight than operations on complex heap allocator structures.
- Protection from memory fragmentation: on the top level allocator works with big memory blocks (pages) instead of small blocks and that reduces risk of memory fragmentation by a lot.
- Cache coherency: chunks are allocated on continuous blocks of memory (pages), therefore in most cases logically adjacent data will be stored in adjacent memory addresses.
Cons:
- You need to manually shrink/clear pool allocators if your memory usage strategy is not stable. For example, you may allocate lots of chunks for temporary objects during level loading and you will no longer need this data after level is loaded, so you need to manually clear or shrink that pool.
- Pool allocators only work for fixed size chunks with size greater or equal to the size of pointer. If you need variable-size cache coherent allocations or need to allocate smaller blocks of memory you need to use other approach.
Stack
Stack allocators usually operate on preallocated block of memory and provide memory in a stack-like fashion by increasing stack top pointer. At the beginning stack top pointer looks at first byte of allocator-managed memory region. Each allocation is done by moving stack top pointer forward. Deallocations are done by moving this pointer backward. You can already see the problem in this pattern: deallocation can not be done in random order. That’s true: there is no canonical deallocation in stack allocator API, instead there is return-to-checkpoint operation, that moves stack top pointer to saved position from the past. This operation deallocates everything that was allocated after checkpoint.
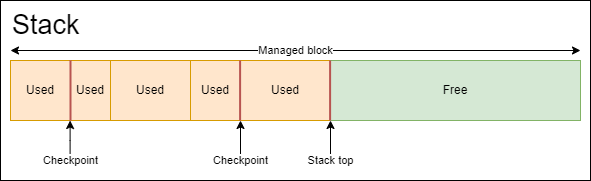
Emergence::Memory service provides implementation of this type of allocator through Stack class. It preallocates memory block of given capacity and operates on top of this block. Stack supports following operations:
Acquire– allocates given amount of bytes with given alignment and moves stack top forward.Head– returns stack top pointer that can be saved and used as checkpoint later.Release– moves stack top pointer back to given checkpoint.Clear– moves stack top pointer back to the beginning.GetFreeSpace– returns how much space is left to be used.
Stack allocators are simple and powerful, but also usually a niche solution. Let’s go over its pros and cons.
Pros:
- Lighting-fast allocation: nothing can be faster than one simple pointer operation.
- Lighting-fast mass-deallocation: we can deallocate all object in one pointer operation without updating anything except stack top pointer.
- Does not cause memory fragmentation: stack only preallocates memory during construction and never actually allocates memory from heap after that.
Cons:
- Stack allocator is only suitable for trivially-destructible objects due to its mass-deallocation approach.
- Stack operates on fixed amount of memory and can never grow bigger than predefined capacity.
- Stack does not support selective deallocation: you either deallocate everything by reverting to a checkpoint or deallocate nothing.
To sum up, stack allocator is one of the best examples of niche solutions. It is almost completely unusable for general purpose situations, but is very helpful for some special cases. For example, it is a usual solution for temporary trivial objects with one-frame lifetime: during frame all systems than need such objects request memory for them though stack allocator and when frame ends these objects are easily deallocated all-at-once.
Heap
Heap allocators theme is quite interesting from technological point of view and it deserves a separate article for sure! But in Emergence I’ve decided to avoid inventing my own bicycle, which is quite rare as I’m almost always inventing my own bicycles, and use malloc, realloc and free under the hood of Heap wrapper-class. Heap allocators are universal generic solution, but there are reasons for the existence of other allocators, so let’s go over pros and cons of this allocator type.
Pros:
- Universal: allocate whatever you want whenever you want.
Cons:
- Slower than specialized allocators, like pool and stack allocators.
- Has high risk of memory fragmentation when lots of small objects are allocated and deallocated.
String interning
String interning is an important technique that allows to both save the memory and improve application performance if you use it right. Interned strings are stored in a special pool and are never duplicated. That makes equality check, hash calculation and string copying lighting fast, because interned string object is essentially just a pointer to the real string in interned strings pool. But it also slows down string creation from raw values, because it adds string interning pass to construction routine.
Emergence::Memory service provides string interning implementation for ASCII strings through UniqueString class. Let’s take a quick look at how interned strings pool is organized there.
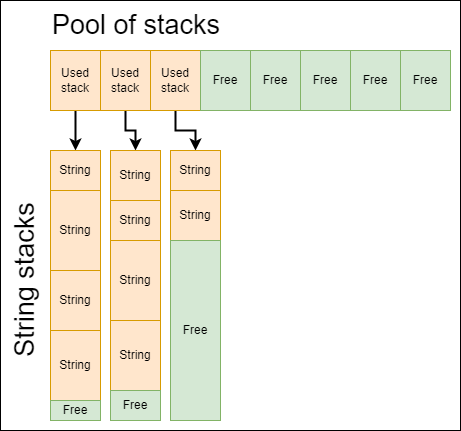
Instead of spreading strings all over the memory (which would cause memory fragmentation), we’re storing them in special memory structure: pool of string stacks. It is essentially pool allocator of stack allocators that are used to allocate interned string values. When current string stack is filled we allocate new stack and continue to allocate strings through it. Interned strings are never deallocated as it makes interning logic more performant and easy-to-use. To check whether string value is already interned or not we keep separate hash set of strings that hashes interned strings by their values instead of their pointers. It allows us to do this check in almost O(stringLength), but, of course, eats additional memory.
As every other memory-related solution, string interning is not a silver bullet and has its pros and cons.
Pros:
- Provides lighting-fast equality check, hash calculation and string copying.
- Guarantees that strings are not duplicated in memory.
Cons:
- Most implementations store interned values for whole program execution, therefore temporary strings should never be interned.
- Interning is not a fast operation, so it should not be called every frame and should not be called on temporary strings.
Implementing your own string interning library is much easier than it sounds! If you wanna try, check out my article about implementation of trivial string interning routine.
Profiling
It’s important to understand how your memory model scales as the project growth and good memory profiler is crucial to achieve this goal. Good memory profiler provides developers with tools that allow to see the big picture and to identify problems early. I’ve decided that I need following features from Emergence memory profiling:
- It should be instrumental, but still reasonably fast and lightweight. Instrumental profiling would allow us to track every memory operation and find even the smallest bad patterns like continuous allocation and deallocation in one particular task every frame.
- It should be able to differentiate between used and reserved memory. Emergence uses pool allocators a lot so it is very important to see whether memory is used or reserved for future usage.
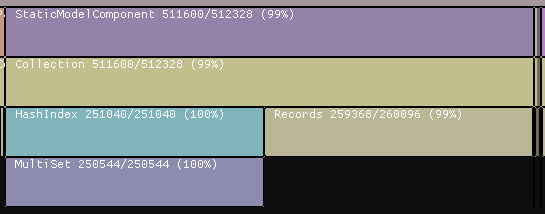
- It should be able to provide memory usage flame graph at any particular moment of time. Flame graphs are quite useful, because they allow to easily switch from bigger picture to details and vice versa. For example, it could be easy to see that particular component storage consumes too much memory, because it is too wide. Flame graph allows us to go further into to see what actually consumes memory: for example, component data or indices. Image below shows that indices of
StaticModelComponentconsume half of the storage memory!
- It should provide an API for implicit hierarchy creation. For example, let’s imagine that we have a
Storagelibrary and aStorageManagerlibrary.Storageknowns nothing ofStorageManager, but it should be a child ofStorageManageron flame graph. So, there should be a way to pass this hierarchical dependency toStorageimplicitly, without explicitly adding knowledge ofStorageManager.
I didn’t find any ready-to-integrate solution that has all these features at once, therefore I’ve decided to write my own memory profiling solution and integrate it with Emergence::Memory allocators. Also, I’ve chosen to separate this solution into 3 parts: profiling backend, that is directly integrated with Emergence::Memory service, runtime tracking library with serialization support and client application. I’ll describe each part separately.
Profiling backend
Emergence::MemoryProfiler service is used as profiling backend: it implements memory usage calculations, registers operations and provides low-level capture API. It was intentionally separated from Emergence::Memory service for two reasons:
- We need to be able to disable memory profiling in release builds by selecting special empty implementation and that should not affect memory allocators implementation selection.
- Profiling logic is not technically coupled with allocation logic, so there is no sense to introduce coupling by merging them into one service.
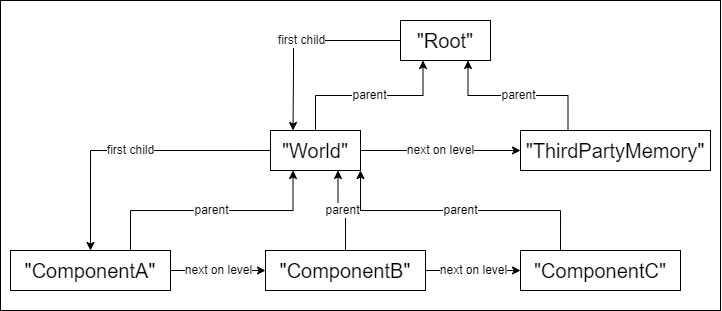
The heart of the profiling backend is AllocationGroup class which provides API for memory operations registration. AllocationGroup is not only a registration API provider, but also is a part of memory usage hierarchy: groups are organized into tree graph with predefined Root group as tree root. Every AllocationGroup stores its id, reserved memory amount, used memory amount and pointers to parent, first child and next on level groups. Although referencing model might look a bit weird, it allows us to avoid usage of complex containers. Picture below illustrates how AllocationGroup referencing looks like.
AllocationGroups themselves are allocated through unprofiled OrderedPool. Of course, it is impossible to profile how much memory profiling takes, because it would introduce cyclic dependency in initialization order. Usage of OrderedPool helps us to improve performance of AllocationGroups by making access to distinct groups cache coherent.
One of the important questions that I asked myself was: how to make AllocationGroup construction and management as convenient as possible? I’ve came up with two fundamental principles:
AllocationGroupclass works as handle to real allocation group, thereforeAllocationGroupconstruction does not always results in construction of an actual allocation group. If allocation group with the same id already exists, newAllocationGroupwill simply reference this implementation-level allocation group. This approach allows user to createAllocationGroupinstances whenever he needs without worrying about referencing and duplicates: everything is resolved on implementation level.- Thread-local
AllocationGroupstacks should be used to provide implicit parent selection unless parent group is selected explicitly. Stacks fit perfectly into this task: they provide intuitive interface for tasks like this. Also, stack usage allows to create connection between allocation groups from different modules without actually adding knowledge about each other to these modules. For example:
1
2
3
4
5
6
7
8
9
10
11
// Storage module places its own allocation group on top before construction an object.
auto placeholder = GetAllocationGroup ().PlaceOnTop ();
objectMapping.Construct (object);

// Object expects right group to be placed on top during construction.
class MyCustomObject final
{
    // ...
    Container::Vector<StandardLayout::Patch> patches {Memory::Profiler::AllocationGroup::Top ()};
    // ...
};
Now let’s get a quick look at AllocationGroup registration methods:
Allocateregisters increase of reserved memory amount.Acquireregisters transfer from reserved memory into used memory.Releaseregisters transfer from used memory to reserved memory.Freeregisters decrease of reserved memory amount.
As you can see, this API is tailored for allocators than deal with memory reservation, which is the case for most allocations inside Emergence.
Now it’s time to have a look at low level capture API. It consists of two major parts:
CapturedAllocationGroupclass, that represents state of specific allocation group at the moment when capture was started. User receivesCapturedAllocationGroupof predefined rootAllocationGroupthat represents captured allocation group hierarchy and can be traversed like normal allocation group hierarchy.Event model, that consists of
Eventstructure, that contains all the info about one specific memory operation, andEventObserver, that provides API for reading new events and works as a mailbox: user can extract events in historical order at any moment. One important implementation detail is that all observers use shared event queue which makes event management complexity independent of observer count.
To start capturing memory profiling data user just needs to call Capture::Start method, that will capture all AllocationGroups and create EventObserver for observing everything that happened after capture. To make event sequence easier to analyze, special marker events are also supported: user can put markers with custom ids using AddMarker method. Markers are treated like usual memory operation events. Although this API is pretty simple and straightforward, it is powerful enough to be foundation for more complex and sophisticated top-level API.
One significant theme, that I missed above, is how profiling backend deals with multithreading. I’ve though about trying to use some elaborate solution for this, but in the end I’ve decided to use one shared spin lock for all profiling-related operations. And it’s not as clumsy as it may sound: all profiling methods are already tailored to be as quick and small as possible, therefore lightweight spin lock looks like a perfect fit here.
Runtime tracking with serialization support
Profiling backend provides API for retrieving data, but retrieving is not enough: we need a library that manages profiling data and provides tools to analyze and serialize this data. That’s the goal of Emergence::MemoryRecording library. Its API provides user with ability to:
- Examine state of any allocation group at any moment of time provided this moment is inside profiling track.
- Read all events inside profiling track in historical order.
- Serialize and deserialize profiling tracks.
- Capture profiling tracks at runtime.
The most important part of Emergence::MemoryRecording library is Track class, that stores full profiling track data and provides an API to iterate over that data and fetch allocation group states. That means that Track plays both the role of data storage and data provider.
As data storage, Track stores all profiling events in linked list, backed by pool allocator. For algorithmic convenience initial state of captured groups is also provided as group declaration events. We need this type of events to store information data about newly found allocation groups, otherwise we would need to duplicate this information in every operation event. So, if this additional event type is already needed, why not use it to save initial state too?
As data provider, Track provides state of any allocation group through RecordedAllocationGroup class instances. This class mimics CapturedAllocationGroup, but its instances are managed and update by owner Track. Time selection is done through movement of current event iterator using MoveToPreviousEvent and MoveToNextEvent methods. This approach is more universal than direct selection of time, because it allows iteration over all events without worrying about how they are separated by time. Also, it allows user to user to observe state of memory after any operation even if two operations are separated by very small amounts of time like 1 microsecond.
But how to populate Track with profiling data? There are two ways to do it: capture data at runtime using RuntimeReporter or load data from stream using StreamDeserializer. RuntimeReporter session is initialized through Begin method that accepts Track pointer and reference to captured root group, that will be converted into group declaration events for whole hierarchy. Then it expects user to pass events from EventObserver to RuntimeReporter through ReportEvent method whenever user wants to update Track. Session could be ended through the End method and after that RuntimeReporter could be reused. StreamDeserializer follows the session pattern: it requests track and stream pointers in Begin and parses events one-by-one using TryReadNextEvent method. One-by-one parsing is especially important when profiling tracks are quite long: it allows to spread data loading to several frames and by doing so avoid freezing tool that loads this profiling track. And due to instrumental profiling tracks usually grow quite fast, so it is important to avoid reading everything at once.
Serialization is done through StreamSerializer, that kind of mimics RuntimeReporter, but uses output stream as target instead of Track instance. Its Begin method accepts pointer to output stream and reference to captured root group. Then serialization is done using SerializeEvent method that takes profiling event as parameter and creates group declaration event for profiling track automatically if it is needed. One-by-one serialization is used for flexibility: user can limit how much time is spent serializing profiling data.
To sum up, Emergence::MemoryRecording provides high-level API for working with profiling data, including state playback and serialization.
Client application
I’ve created a client application for viewing serialized profiling tracks:
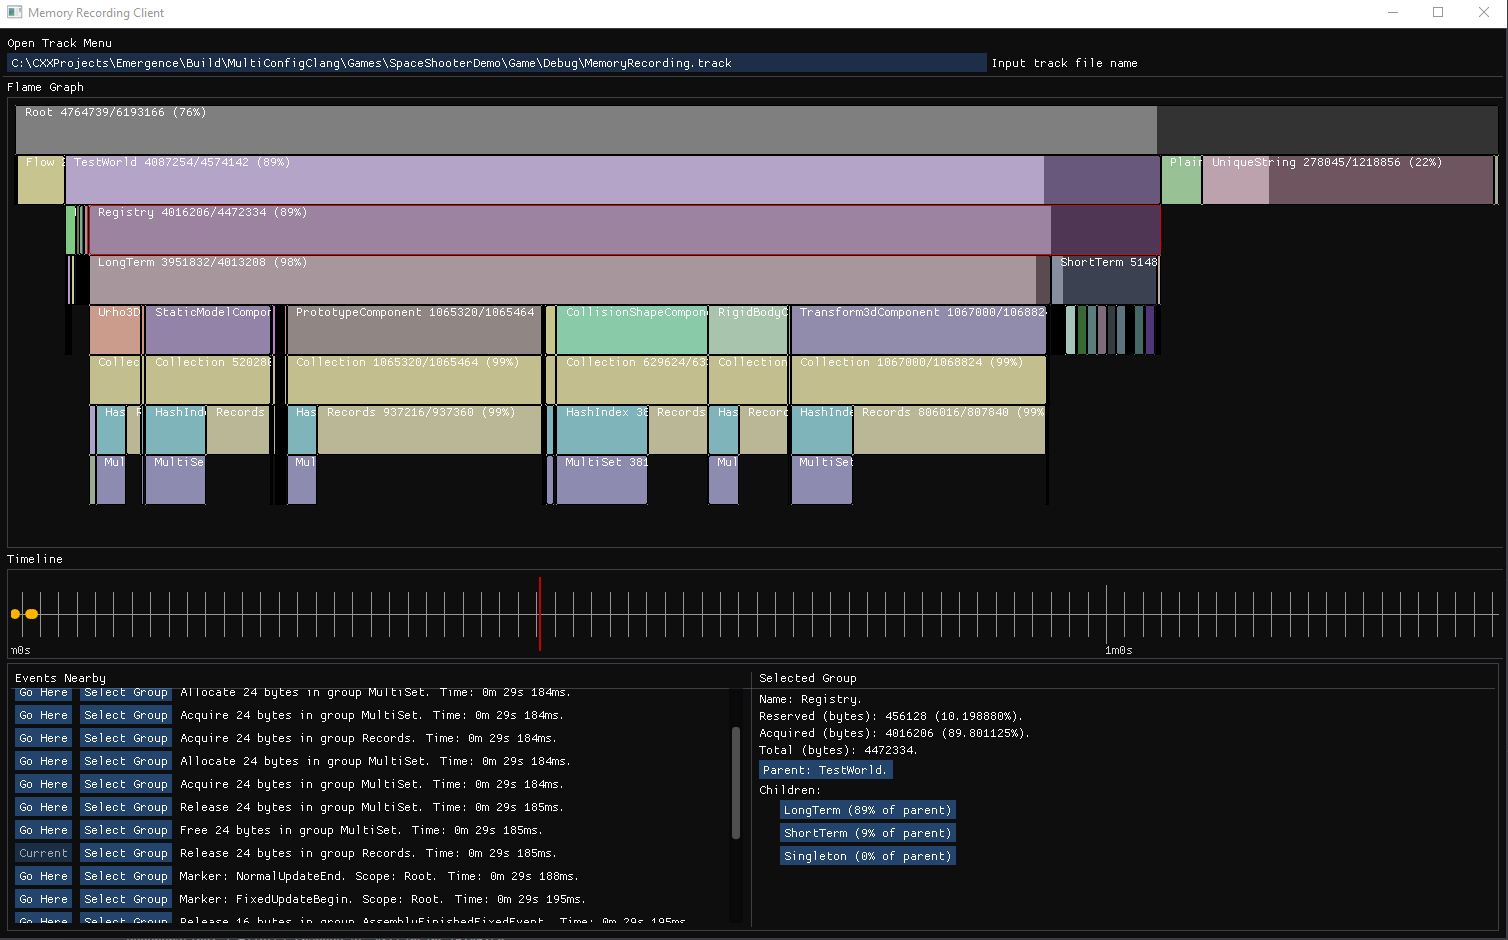
- It shows memory usage flame graph with every group with used-to-total memory percentage.
- Flame graph visual can be scaled and moved in any way user likes.
- It shows timeline with markers. Markers with high frequency are shown only when timeline scale is low enough.
- It shows list of events that are near current event, which allows user to easily jump to required event.
- It allows user to select group on flame graph and view detailed info about this group and its children.
Client application uses ImGui and SDL2. It is a thin UI layer built on top of Emergence::MemoryRecording, therefore it’s not really a lot to discuss here.
In future I’m planning to add automatic analyzers to client application that will track down common memory usage errors, that lead to performance drops. For example, underreservation, when there is not enough memory reserved for particular group and it always allocates new memory and them frees it, and overreservation, when too much memory is reserved for particular allocation group and this memory is never used to full extent.
Conclusion
As I said earlier, having consistent memory model and using a right approach for memory management in project is very important. That’s why I’ve spent a lot of time on designing and testing Emergence memory-related libraries. I cannot say that these libraries are ideal as nothing is ideal in this world, but I believe that they’re good enough to support this project and its growth.
Hope you’ve enjoyed reading! If you have any suggestions, feel free to contact me through telegram or email.